Stringfellow Superfund Site Monitoring Optimization (MAROS)
Contact: Liz Simmons, Kleinfelder, Inc., [email protected]

Problem Statement
Groundwater has been affected by chemicals originating from a hazardous waste disposal facility. There are over 500 wells in the site’s four operational zones, and over 460 of these wells, including extraction wells, have recently been monitored as part of site groundwater monitoring programs. Groundwater monitoring optimization, including geospatial methods, was conducted to identify a spatially efficient network that minimizes both uncertainty and redundancy.
Project Objectives
Groundwater monitoring optimization analyses were performed to provide recommendations for optimizing the groundwater monitoring network and program at the site. This evaluation used qualitative decision analysis and quantitative methods. Specifically, the following objectives guided the evaluation:
- Assess the effectiveness of the existing site monitoring program in tracking temporal and spatial information on groundwater chemistry and groundwater elevations.
- Propose modifications to the monitoring program based on the results of the effectiveness evaluation, as a means to increase efficiency and reduce cost while maintaining protection of human health and the environment and progress toward site objectives.
Site Background
The site is a former Class I hazardous waste disposal facility that operated from the 1950s through 1970s, in which more than 34 million gallons of industrial waste were placed in evaporation ponds located at the facility during that period. The wastes consisted primarily of metal finishing waste products, solid propellants and explosives, electroplating materials, and pesticides. Several hundred groundwater monitoring and extraction wells have been installed at the site since the early 1980s. Contaminants in soil and groundwater at the site include volatile organic compounds (VOCs), semivolatile organic compounds (SVOCs), pesticides, perchlorate, n-nitrosodimethylamine (NDMA), 1,4-dioxane, para-chlorobenzene-sulfonic acid (pCBSA), salts, and heavy metals including cadmium, nickel, chromium, copper, manganese, and zinc. Groundwater in portions of the disposal area is highly acidic, with low pH values (below a pH of 1).
As a result of waste disposal practices, groundwater was affected by various contaminants that have migrated from the original disposal area approximately five miles southward to the vicinity of the river. Private water supply and irrigation wells have also been affected. The primary chemicals of concern, which currently consist of perchlorate, TCE, and chloroform, have been detected in alluvial, weathered bedrock, and bedrock aquifers. The site has been divided geographically into four groundwater zones, considering various site operational and remediation activities. Various remedial systems have been installed and are operational in the four zones, from the original disposal area to the downgradient plume.
Data Set

Groundwater sampling at the site began in 1995. The groundwater monitoring network has expanded significantly over the years since monitoring began. At the time of the optimization analysis, groundwater results from 420 monitoring and observation wells and piezometers were analyzed. Sampling has been conducted on an approximately semiannual basis, with other additional sampling dates throughout the time period of the data set. Data evaluated spanned the time interval of April 1995 to December 2011. Concentrations of three contaminants were used for the analysis: chloroform, perchlorate and TCE. Over 3,400 specific date/well records were considered in the analysis.
Methods
Qualitative evaluation of the monitoring program was performed using a basic series of questions and decisions regarding each monitoring well, followed by quantitative statistical analyses of contaminant concentration trends and spatial attributes of each well and well group in the monitoring system. The qualitative and quantitative analysis results were reviewed together in the context of overall monitoring requirements and objectives to develop final recommendations for the monitoring program.
The groundwater monitoring network was evaluated by zone (with respect to sampling protocols), chemicals of concern/other analytes, monitoring frequency, and well integrity as a basis for providing recommendations for optimizing the monitoring program. Each well’s retention and monitoring frequency were evaluated by a qualitative review process that incorporated several decision factors and critical-path decision trees with decision endpoints.
As a second step in the optimization process, the groundwater monitoring network was quantitatively evaluated using statistical methods primarily for temporal and secondarily for spatial analysis, as well as graphical analysis using time-series charts of perchlorate and TCE concentrations. The primary chemicals of concern (perchlorate, TCE, and chloroform) were statistically evaluated using available data for the 16-year monitoring period from April 1, 1995 to Spring 2011. This period was selected to incorporate a sufficient number of monitoring events for statistical analysis for most site wells, since many wells have not been included in every sampling event. MAROS (Version 2.2) was used to perform quantitative analyses for the Stringfellow Superfund Site, for monitoring, and for select extraction wells retained following the qualitative analysis. This program provided well-by-well concentration trend analysis, well-by-well sampling frequency analysis, well data-gap analysis, and plume-stability analysis based on spatial-moment analysis. The MAROS analyses were performed on 420 wells, and comparable records (the same or a similar temporal range of data) were used for both intrawell and interwell comparisons, where possible.
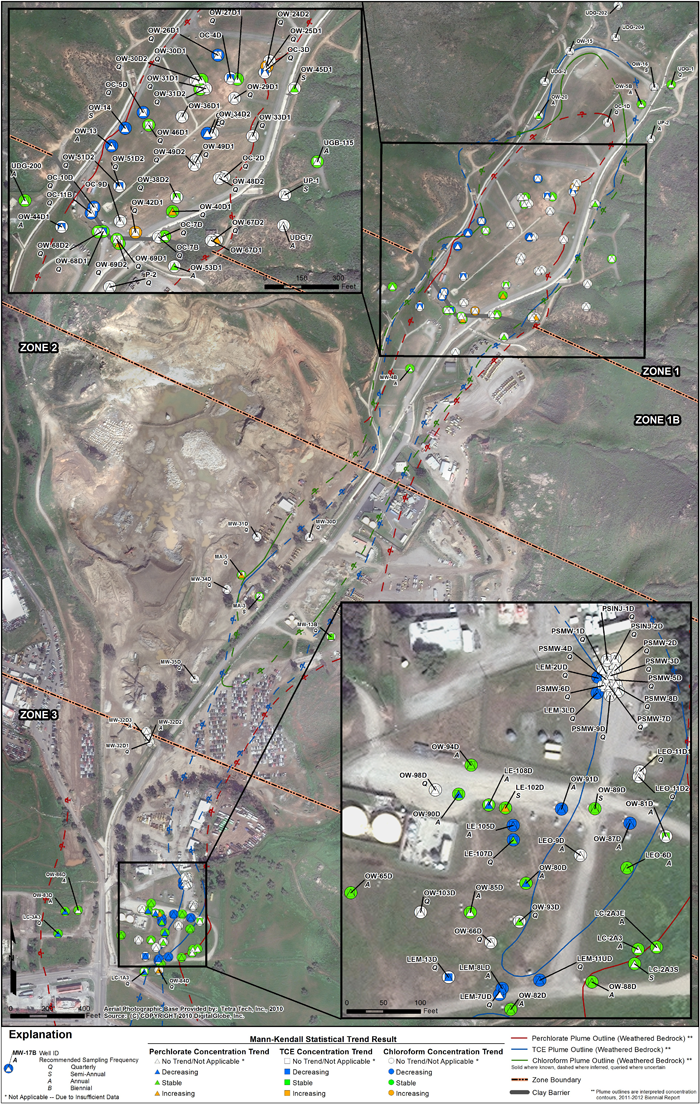
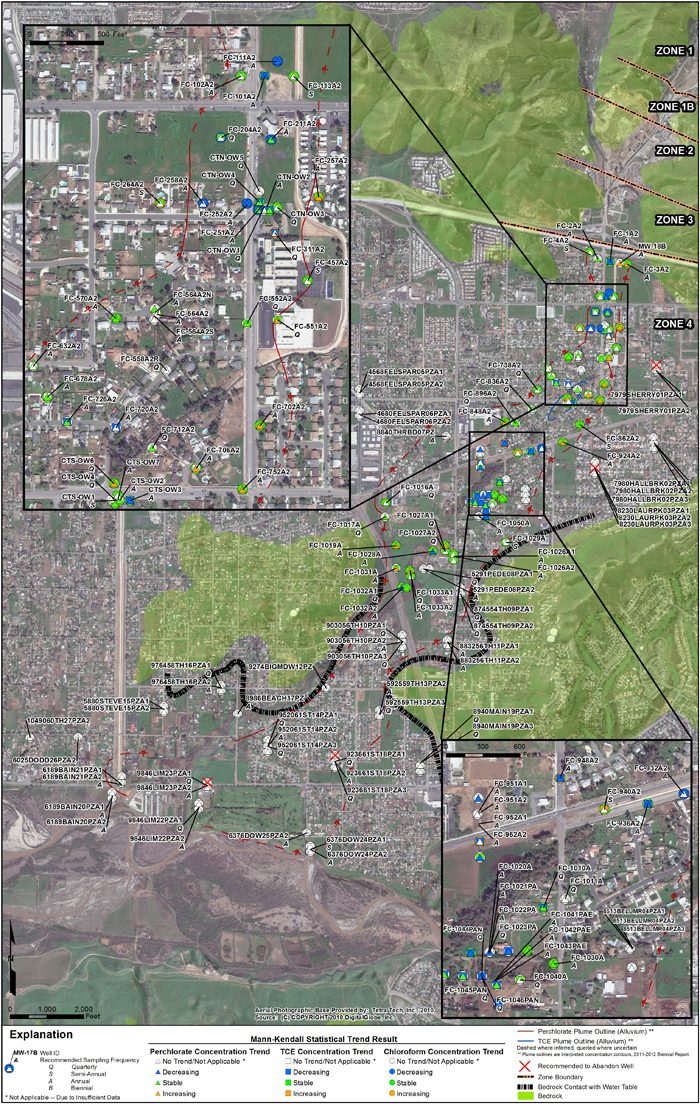
As part of the optimization analyses, site wells were designated as “source” or “tail” wells, which are defined as wells located within and downgradient of each groundwater plume area, respectively. Analyses were performed in two groups, one group for Zones 1 through 3 and a second group for Zone 4. Concentration trends were assessed using Mann-Kendall statistical methods (Figure 120). In general, these wells were selected as having sufficient data for analysis of at least one of the chemicals of concern, or were in an area considered important for the evaluation. Wells were further identified as being completed in the alluvium, weathered bedrock, and unweathered bedrock.


Figure 120. Mann-Kendall trends for perchlorate, TCE and chloroform concentrations in weathered bedrock in northern portion of the plume (above) and in alluvium in southern portion of the plume (below).
Aerial Photographic Base Provided by: Tetra Tech, Inc. 2010, Source Copyright 2010 Digital Globe, Inc.
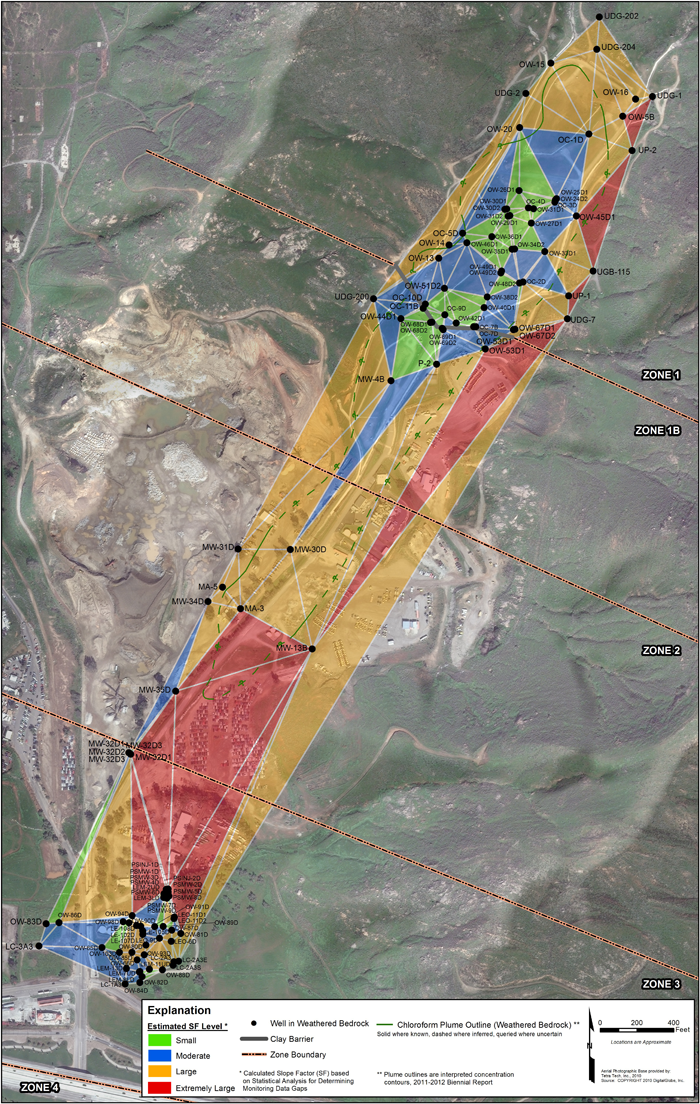
Sampling frequency and analysis of monitoring data gaps was conducted. Well location analysis was performed using Delaunay triangulation and associated calculated factors based on statistical analysis for determination of monitoring data gaps. Monitoring frequency analysis was performed using the Cost Effective Sampling (CES) algorithm (Ridley et al. 1995), which determines sampling frequency based on the analysis of time-series concentration data for each monitoring point, and considers both recent and long-term trends.
Results
MAROS yielded recommendations for optimization by location (remove wells from future testing and/or abandon wells) and by frequency (decrease or increasing monitoring frequency). (Figure 121). These results were evaluated individually against rankings and qualitative evaluation results. MAROS frequency recommendations were generally disregarded because, for several reasons, they were not considered warranted to maintain an understanding of site conditions. These reasons include low sampling frequency (for example, due to lack of water), investigation-specific use for wells (for example, in-situ bioremediation pilot study) that were then intended for destruction, and recent data not included in the MAROS analysis that indicate a different concentration trends. A new version of MAROS was released following this evaluation, which has improved usability and partially remedied some of these issues.

Figure 121. MAROS results for chloroform in weathered bedrock in northern portion of the plume.
Aerial Photographic Base Provided by: Tetra Tech, Inc. 2010, Source Copyright 2010 Digital Globe, Inc.
Some of the specific limitations encountered during use of MAROS include the following:
- In many cases, it was impossible to create an archive file that retained site data or that could be used to save site information, thus requiring that certain information be re-entered for each use.
- The program became unstable when more than approximately 50 wells were entered, which was problematic because the Stringfellow site has hundreds of wells.
- For a very large database of wells and monitoring events, there was no identified functionality to upload a list of the events or well assignments (such as tail, source, and others). All must be selected by hand.
- Only five analytes can be evaluated at one time.
- The program crashed during moment analyses with less than six wells that have detections for each sampling event. A workaround was provided by GSI (add false analyte and detections).
- The program would sometimes crash when attempting to download model results following final analysis, requiring a new start to the analysis.
Spatial analyses were applied to a long, narrow plume primarily controlled by a narrow paleochannel and changing from a canyon environment to an alluvial valley, in addition to vertical transport among three different lithologic units. These conditions likely significantly affected the analyses. Although typically evaluated separately, the three lithologic units are hydraulically connected, with vertical hydraulic gradients affecting contaminant transport. The lesson learned is that complex systems may not be readily amenable to statistical analysis.
Another important technical issue with the statistical methodology is that the spatial analysis is directly affected by temporal changes in the distribution of monitoring points. For example, the addition of monitoring points that provide further plume delineation may result in MAROS concluding that the plume is expanding, although this may not be true. This issue may be partially addressed by only including wells in the analysis that have an identical monitoring period (starting date).


