• Skip to main content
itrc_logo

Geospatial Analysis for Optimization at Environmental Sites

Navigating this Website
Overview
Fact Sheets
Fact Sheets Overview
Fact Sheet 1: Do You Need Geospatial Analysis?
Fact Sheet 2: Are Conditions Suitable for Geospatial Analysis?
Fact Sheet 3: How is Geospatial Analysis Applied?
Fact Sheet 4: What Software is Available to Help?
PM's Tool Box
PM's Tool Box Overview
Review Checklist
Choosing Methods
Common Misapplications
Optimization Questions
Geospatial Analysis Support for Optimization Questions in the Project Life Cycle
Data Requirements
General Considerations
Methods for Optimization
Geospatial Methods for Optimization Questions in the Project Life Cycle Stages
Release Detection
Site Characterization
Remediation
Monitoring
Closure
Documenting Results
Fundamental Concepts
Fundamental Concepts for Geospatial Analysis
Basic Data Concepts for Geospatial Analysis
Interpolation Methods and Model Prediction
Uncertainty in Geospatial Analyses
Characteristics of Interpolation Methods
Work Flow
Work Flow for Conducting Geospatial Analysis
Geospatial Analysis Work Flow Overview
Perform Exploratory Data Analysis
Select Geospatial Method
Build Geospatial Model
Evaluate Geospatial Method Accuracy
Generate Geospatial Analysis Results
Using Results
Using Analysis Results for Optimization
Plume Intensity and Extent
Trend Maps
Estimating Quantities
Hot Spot Detection
Sample Spacing
Estimating Concentrations Based on Proxy Data
Background Estimation
Quantifying Uncertainty
Remedial Action Optimization
Monitoring Program Optimization
Examples
Examples Overview
Example 1
Example 2
Example 3
Example 4
Methods
Methods Overview
Simple Geospatial Methods
More Complex Geospatial Methods
Advanced Methods
Index of Methods
Software
Software Overview
Software Comparison Tables
Software Descriptions
Workshops and Short Courses
Case Studies
Case Studies Overview
Superfund Site Monitoring Optimization (MAROS)
PAH Contamination in Sediments—Uncertainty Analysis (Isatis)
Optimization of Long-Term Monitoring at Former Nebraska Ordnance Plant (GTS; Summit Envirosolutions)
Optimization of Lead-Contaminated Soil Remediation at a Former Lead Smelter (EVS/MVS)
Extent of Radiological Contamination in Soil at Four Sites near the Fukushima Daiichi Power Plant, Japan (ArcGIS)
Optimization of Groundwater Monitoring at a Research Facility in New Jersey (GWSDAT)
Optimization of Sediment Sampling at a Tidally Influenced Site (ArcGIS)
Stringfellow Superfund Site Monitoring Optimization (MAROS)
Lead Contamination in Soil (ArcGIS)
Stakeholder Perspectives
Additional Information
Project Life Cycle Stages
History of Remedial Process Optimization
Additional Resources
Acronyms
Glossary
Index of Methods
Acknowledgments
Team Contacts
Document Feedback


Geospatial Analysis for Optimization at Environmental Sites
HOME

Data Requirements for Geospatial Analysis

Data for geospatial analysis are tied to specific locations and used to inform spatial or spatio-temporal analysis (for example, mapmaking). Consequently, the minimum requirements of the data set for geospatial analysis are different and usually more stringent than those for other analyses. Accurate mapping generally entails more data than, for instance, simple monitoring along a compliance boundary. It is thus critical to check these minimum data requirements prior to conducting a geospatial analysis. If these requirements cannot be met, you may need to obtain additional data or site information, or choose a different geospatial method.

Figure 1 can be used to determine whether the data set is suitable for a geospatial analysis. The information presented in this figure is a general guideline, you must determine whether the site-specific data are sufficient for any specific analysis to support the question being investigated. The basic requirements for geospatial analysis are listed in Table 1.

Table 1. Minimum requirements of data sets for geospatial analysis

Requirement Description
CSM

The CSM must include the following:

  • geometry and approximate boundaries of the area to be studied or analyzed
  • understanding of the geology or hydrology, or both
  • specifics of the sample depth for each data value
  • if sampling soils, information about site geology and types of soil borings; if sampling groundwater, information about site hydrogeology and monitoring wells (for example, depth, screen intervals)
  • chemical concentrations or other relevant parameters of interest in soil samples (for example, geochemistry) from sampling locations, or groundwater samples from monitoring wells, or both
Data locations
  • Named locations and coordinates should be assigned for all sampling locations, whether temporary or permanent, in order to delineate the spatial distribution of the data.
Site monitoring or cleanup goals
  • The purposes for monitoring at the site should be explicitly stated (for example, monitor plume stability, identify exposures, or assess remediation progress).
  • Cleanup goals or criteria are needed, and are usually available in a decision document such as a Record of Decision or an approved Corrective Action Plan.
Data suitable for statistical analysis
  • Data should be analyzed for data quality and statistical usability (ITRC GSMC-1).
  • Data set should also meet the regulatory criteria.
  • Nondetect data are sometimes a concern at a site. ITRC’s GSMC-1 includes information about managing nondetects in statistical analyses.
Data of adequate spatial coverage for the area to be mapped.
  • Adequate spatial coverage generally means that no substantial portion of the target site should lack sampling data; measurements that are spatially clumped together cannot readily be extrapolated with accuracy to unsampled portions of the site. Instead, geospatial samples must have adequate spacing and be spread apart to cover all areas of the site.
  • With the known study boundary as defined in the CSM, adequate spatial coverage within that area precludes adding artificial data points to conform with interpretation and provides a better understanding of the potential edge effects. Ignoring the interdependences and influence across a boundary may cause edge effects.
  • For release detection sampling, the locations are often chosen based on regulatory requirements and nonrandom locations.
  • This requirement also applies to the incremental sampling methodology (ISM). ISM involves sampling to determine the mean concentration within a specified decision unit. ISM does not directly lend itself to geospatial analyses if the objective is to know anything about the population distribution within the decision unit. However, if a large number of ISM replicate samples are obtained from within the decision unit, or a large number of decision units comprise the study area, then geospatial methods may be applied. The scope (or geospatial support) of the individual incremental samples should be considered in assessing the spatial correlation, and the focus should be on a lag larger than the decision unit dimensions; see the ITRC ISM-1 document.
  • For groundwater studies, geospatial analysis works best when the spatial arrangement of the installed wells roughly covers the site, even if the wells are not on a systematic grid.
Adequate number of data
  • The number of data needed depends on the complexity of the analysis to be conducted. Generally, more data are needed for more complex analyses, which are more suitable for sites with large contaminant plumes and extensive monitoring programs.
  • Geospatial analyses may be mathematically possible with very small data sets; however, this practice is not recommended because a smaller data set can lead to significant error.
  • Simple methods generally do not require as large a data set as other more complex methods. A minimum of eight sample locations is recommended. Simple methods are often used for very large data sets for computational efficiency.
  • More complex methods may require a data set with a minimum of 8 to 15 sample locations.
  • Advanced methods require the largest data sets; the minimum is usually greater than 15 (Harre et al. 2009) and perhaps greater than 30 to 100 sample locations, depending on the site, objectives, and data set. For more information, see Webster and Oliver Webster and Oliver 2001 and ASTM ASTM 2010a ASTM (2010b).
Sampling history
  • If performing a spatio-temporal analysis, for example, during long-term groundwater monitoring optimization (LTMO), a sampling history from each well should be available covering at least 4 to 8 distinct sampling events over a period of at least a two years of recent monitoring. More information about temporal analysis is available in the ITRC GSMC-1 document.

gro_min_data_chart_2_1_10_19_16

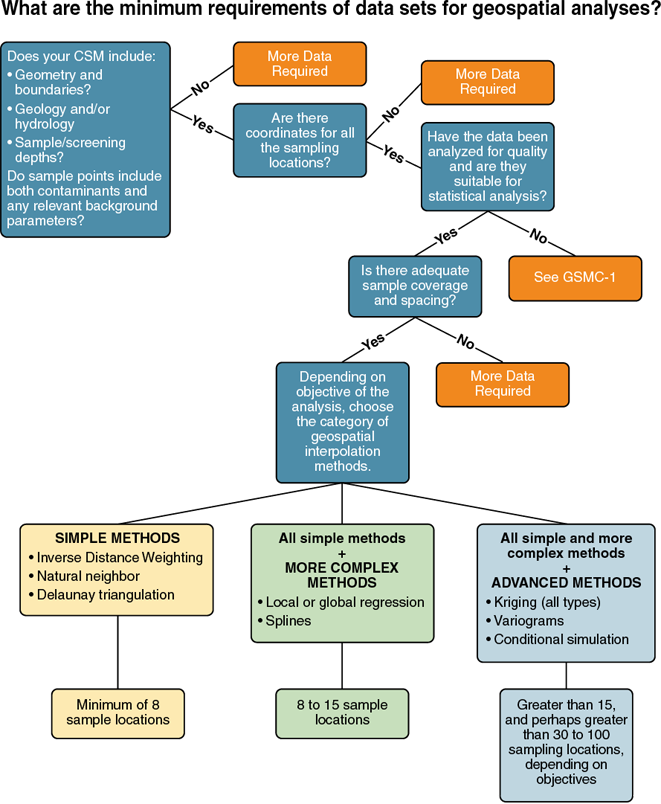
Figure 1. Approach to determine minimum data set requirements for geospatial analysis.
Note: This figure should be used along with the information in Table 1.

image_pdfPrint this page/section


GRO

web document
glossaryGRO Glossary
referencesGRO References
acronymsGRO Acronyms
ITRC
Contact Us
About ITRC
Visit ITRC
social media iconsClick here to visit ITRC on FacebookClick here to visit ITRC on TwitterClick here to visit ITRC on LinkedInITRC on Social Media
about_itrc
Permission is granted to refer to or quote from this publication with the customary acknowledgment of the source (see suggested citation and disclaimer). This web site is owned by ITRC • 1250 H Street, NW • Suite 850 • Washington, DC 20005 • (202) 266-4933 • Email: [email protected] • Terms of Service, Privacy Policy, and Usage Policy ITRC is sponsored by the Environmental Council of the States.