• Skip to main content
itrc_logo

Geospatial Analysis for Optimization at Environmental Sites

Home
About ITRC
Navigating this Website
Overview
Fact Sheets
Fact Sheets Overview
Fact Sheet 1: Do You Need Geospatial Analysis?
Fact Sheet 2: Are Conditions Suitable for Geospatial Analysis?
Fact Sheet 3: How is Geospatial Analysis Applied?
Fact Sheet 4: What Software is Available to Help?
PM's Tool Box
PM's Tool Box Overview
Review Checklist
Choosing Methods
Common Misapplications
Optimization Questions
Geospatial Analysis Support for Optimization Questions in the Project Life Cycle
Data Requirements
General Considerations
Methods for Optimization
Geospatial Methods for Optimization Questions in the Project Life Cycle Stages
Release Detection
Site Characterization
Remediation
Monitoring
Closure
Documenting Results
Fundamental Concepts
Fundamental Concepts for Geospatial Analysis
Basic Data Concepts for Geospatial Analysis
Interpolation Methods and Model Prediction
Uncertainty in Geospatial Analyses
Characteristics of Interpolation Methods
Work Flow
Work Flow for Conducting Geospatial Analysis
Geospatial Analysis Work Flow Overview
Perform Exploratory Data Analysis
Select Geospatial Method
Build Geospatial Model
Evaluate Geospatial Method Accuracy
Generate Geospatial Analysis Results
Using Results
Using Analysis Results for Optimization
Plume Intensity and Extent
Trend Maps
Estimating Quantities
Hot Spot Detection
Sample Spacing
Estimating Concentrations Based on Proxy Data
Background Estimation
Quantifying Uncertainty
Remedial Action Optimization
Monitoring Program Optimization
Examples
Examples Overview
Example 1
Example 2
Example 3
Example 4
Methods
Methods Overview
Simple Geospatial Methods
More Complex Geospatial Methods
Advanced Methods
Index of Methods
Software
Software Overview
Software Comparison Tables
Software Descriptions
Workshops and Short Courses
Case Studies
Case Studies Overview
Superfund Site Monitoring Optimization (MAROS)
PAH Contamination in Sediments—Uncertainty Analysis (Isatis)
Optimization of Long-Term Monitoring at Former Nebraska Ordnance Plant (GTS; Summit Envirosolutions)
Optimization of Lead-Contaminated Soil Remediation at a Former Lead Smelter (EVS/MVS)
Extent of Radiological Contamination in Soil at Four Sites near the Fukushima Daiichi Power Plant, Japan (ArcGIS)
Optimization of Groundwater Monitoring at a Research Facility in New Jersey (GWSDAT)
Optimization of Sediment Sampling at a Tidally Influenced Site (ArcGIS)
Stringfellow Superfund Site Monitoring Optimization (MAROS)
Lead Contamination in Soil (ArcGIS)
Stakeholder Perspectives
Additional Information
Project Life Cycle Stages
History of Remedial Process Optimization
Additional Resources
Acronyms
Glossary
Index of Methods
Acknowledgments
Team Contacts
Document Feedback


Geospatial Analysis for Optimization at Environmental Sites
HOME

Release Detection

Has a release occurred?

During release detection, sampling data are collected near known waste deposits or ecological receptors to determine whether a statistically significant contaminant release into environmental media has occurred. Given that geospatial methods require substantial preexisting data, they are best applied when ongoing monitoring provides the necessary data set (such as detection monitoring at a RCRA waste disposal unit or a landfill). Geospatial methods are also best applied where the contaminants are detected above background levels, such as with some metals, or where the detections of organic contaminants are observed but the concentrations are not over some action level. Information about managing nondetect data is included in the GSMC-1 document.

During release detection, geospatial methods can help to optimize the following:

  • identifying additional monitoring locations
  • determining background values (see GSMC-1 for more information about background conditions)
  • determining the horizontal and vertical extent sufficient to make appropriate initial decision
  • assessing the number of monitoring locations and frequency of monitoring

Optimization through geospatial methods is sometimes limited by the lack of data at this stage in the life cycle.

Figure 2 provides an overview of the role of geospatial methods in this stage of the project life cycle. Each general topic and specific question is linked to a more detailed discussion.

Figure 2 Release Detection

Click Here to go to Plume Detection and Estimation Click Here to go to Trend Maps Click Here to go to Estimation of Average Concentration Click Here to go to Hot Spot Detection

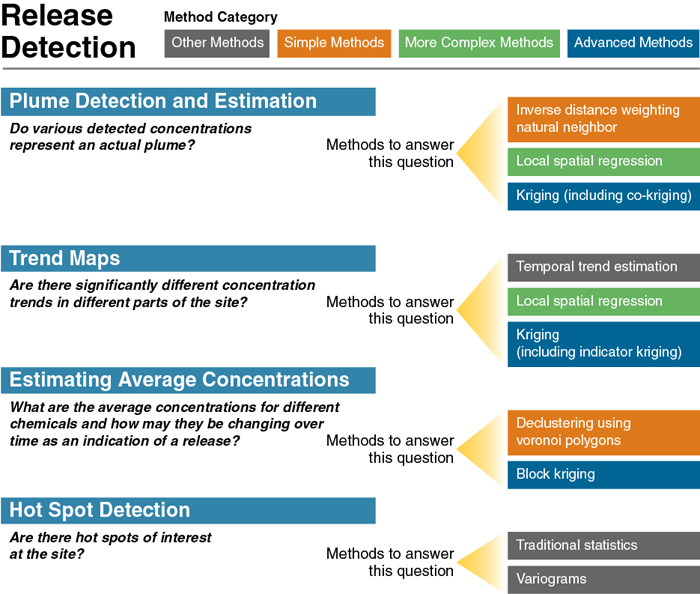
Figure 2. Release detection overview.

Release Detection: Plume Detection and Estimation

Do various detected concentrations represent an actual plume?
▼Read more

Geospatial techniques offer spatial mapping of measurement data; they serve as an alternative to professional judgment or hand contouring when creating site maps. Mapping can help to locate areas of a site where a plume may be developing and assists in qualitatively determining whether a plume is present. For more information, see the discussion on using geospatial results to determine plume intensity and extent.

Geospatial Methods:

  1. Simple geospatial methods (for example, inverse distance weighting, natural neighbor interpolation) can also provide a map and, in some cases, a measure of a goodness of fit.
  2. More complex methods (for example, local spatial regression) can be used to interpolate the data over time and space or easily incorporate other predictor variables into the analysis to improve the interpolation.
  3. Kriging (including co-kriging, for example, with an indicator compound) can map the plume and assess uncertainty in the interpolations between data points.

Release Detection: Trend Maps

Are there significantly different concentration trends in different parts of the site?

▼Read more

Trend maps are an efficient way to look for possible contaminant releases. Instead of mapping the site and tracking the map over a series of time points, the slope direction and magnitude are estimated at each sampling location and then plotted on a site map, which can be contoured. A trend map provides a spatial overview of which areas of the site are increasing or projected to increase in concentration, as well as how quickly the concentrations are changing. Further discussion on how to use the trend map is provided in remediation trend map section. For more information on using geospatial results to understand trends, see Trend Maps.

Geospatial Methods:

  1. Temporal trend estimation (for example, linear regression, Mann-Kendall, Theil-Sen) can be combined with posting of the magnitude and direction of the trends at specific locations on a map. The GSMC-1 document (ITRC 2013) includes more information on trend estimation methods.
  2. More complex methods (for example, local spatial regression) can be used to interpolate the data over both space and time to provide a series of plume maps at different times.
  3. Kriging, including indicator kriging, can be used to map the likely distribution of the determined trend. The statistical confidence in the trend (positive values for increasing trends and negative values for a decreasing trend) can be kriged, or indicator kriging can be used to evaluate certainty of trends by assigning a one to an increasing trend and a zero to the opposite trend.

Release Detection: Estimating Average Concentrations

What are the average concentrations for different chemicals and how may they be changing over time as an indication of a release?

▼Read more

In order to assess whether a plume might be emerging, the average site concentration can be estimated and periodically tracked over time. See the further discussion of using geospatial results in estimating quantities and average concentrations.

Geospatial Methods:

  1. Averages of spatial data can be affected by spatial correlation (nonindependent data). Declustering using a grid or Voronoi polygons can be applied to weight spatially clustered data. This practice results in a more accurate estimate of the population mean.
  2. Block kriging can also be used to account for spatial correlation in assessing averages over a block or study area.

Release Detection: Hot Spot Detection

Are there hot spots of interest at the site?

▼Read more

During release detection, it may be necessary to identify areas of elevated concentration (hot spots) or to evaluate the likelihood that areas of the site exceed regulatory limits. Hot spots can be found by sampling on a systematic grid with traditional statistics or through use of row- and column-aligned incremental sampling methods (ISM). Geospatial analysis of these data may help to identify hot spots. Geospatial methods may allow better incorporation of hot spot concentrations in characterizing site conditions. Examples include ordnance detection with geophysical data, or characterization of a large area with random storage or disposal of hazardous waste. Note that geospatial methods require some existing data to guide the collection of additional data. Choosing efficient and effective sample spacing (in space or time) for any medium can help to optimize a sampling program for detection of a hot spot. For more information, see the discussion of using geospatial results in hot spot detection.

Geospatial Methods:

  1. Variograms can help select optimal grid spacing based on the degree of spatial correlation for detecting hotspots of a given size. The variograms can indicate the distances at which the sampling locations can be spaced without yielding too much duplicative information. Hot spots usually have high variability over short distances, so closer spacing is appropriate.


image_pdfPrint this page/section


GRO

web document
glossaryGRO Glossary
referencesGRO References
acronymsGRO Acronyms
ITRC
Contact Us
About ITRC
Visit ITRC
social media iconsClick here to visit ITRC on FacebookClick here to visit ITRC on TwitterClick here to visit ITRC on LinkedInITRC on Social Media
about_itrc
Permission is granted to refer to or quote from this publication with the customary acknowledgment of the source (see suggested citation and disclaimer). This web site is owned by ITRC • 1250 H Street, NW • Suite 850 • Washington, DC 20005 • (202) 266-4933 • Email: [email protected] • Terms of Service, Privacy Policy, and Usage Policy ITRC is sponsored by the Environmental Council of the States.