Example 4
| Example 4: Sampling Design Strategy |
|---|
|
Application: Sampling Design Strategy
Source: Example courtesy of James R. Henderson, TruGround Environmental. [email protected] Application Summary: A geostatistical/variogram analysis was employed to assist in the identification of data gaps, and in turn, development of optimal future sampling strategies to address data gaps. Software: Visual Site Plan (VSP), ArcGIS/Geostatistical Analyst or other software capable of spatial interpolation and variography. Methods: Geostatistical semivariogram analysis. Data Requirements: See recommendations regarding data requirements for variography, typically a minimum of 30 samples. References: ASTM 2010a; Deutsch and Journel 1992; Englund and Sparks 1988; Isaaks and Srivastava 1989; USEPA 1996; Woolfenden and Koczot 2001. |
|
Approach: As part of a data needs assessment, a review of existing surficial (0-2 ft) soils was completed to assess compliance with regulatory risk based criteria. A geostatistical analysis was used to identify data gaps, and then develop optimal future sampling strategies to address data gaps. The scope of this geostatistical analysis included the following steps:
Results:
Step 1: Figure 57/Step1 provides an illustration of a GIS based exploratory analysis which visually identifies obvious data gap areas. In this case, two areas are noted as lacking soil copper data, which will require collection of data at a certain count and distribution to be filled. Step 2: Under the assumption that the copper impact patterns observed at areas near these data gaps are reasonably expected to be similar, variography was used to determine sample size and spacing. Using the surficial soil copper data, a variogram (Figure 57/Step 2) was generated and the resulting range of correlation was calculated to be 100 ft. This result means that the soil copper data are correlated in such a way that concentrations can be interpolated (for example, kriged) between samples that are no greater than 100 ft apart. Thus, any identified areas that have samples at a distance greater than 100-ft would require further sampling to eliminated this data gap. Step 3: With the variography completed, a sampling design scheme was developed to address the previously described data gaps based upon a range correlation value of 100-ft. Thus a systematic grid with separation distances no greater than 100 ft was used a design guideline for future sampling, (Figure 57/Step 3). The variography should always be repeated after sampling to ensure that the original 100-ft range was adequate. |
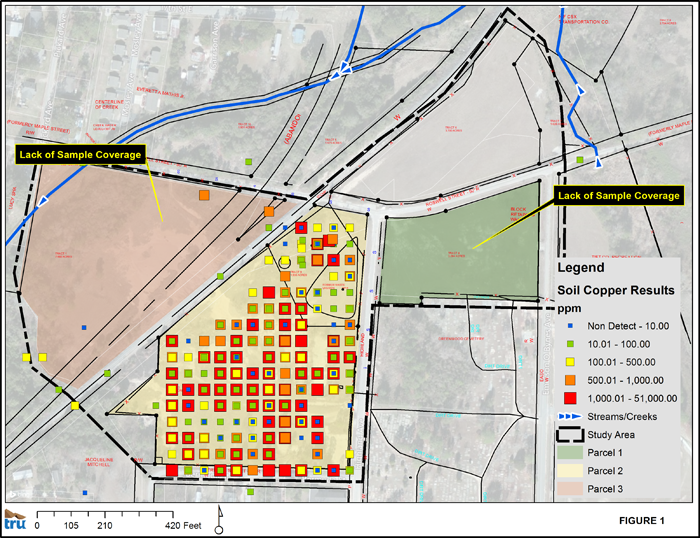
Step 1
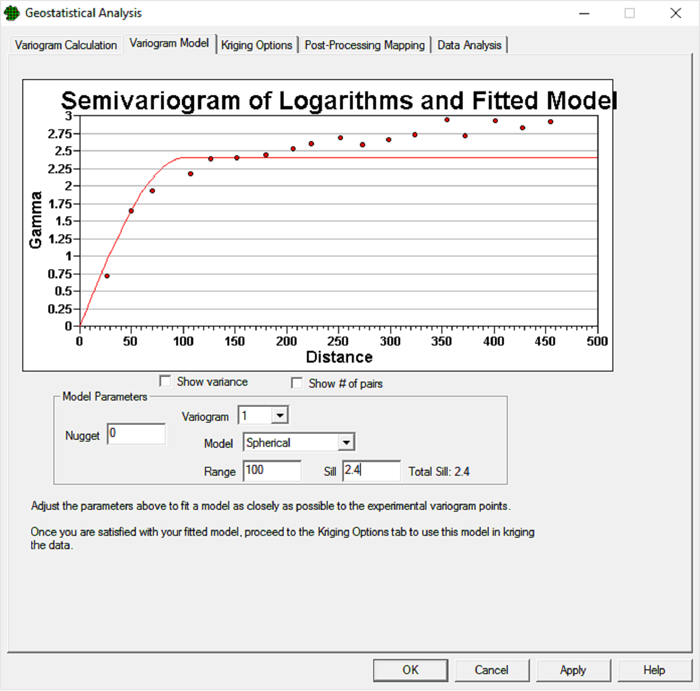
Step 2
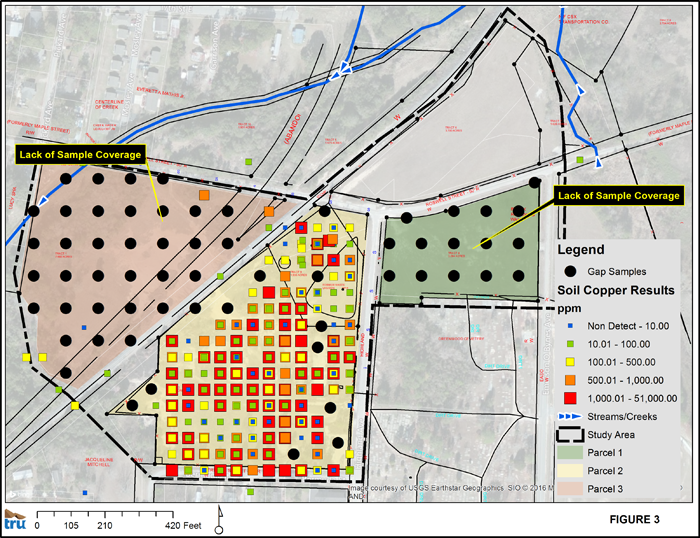
Step 3
Figure 57. Illustration of the steps in the sampling design strategy.
Source: Image courtesy of USGS Earthstar Geographics SIO© 2016 Microsoft Corporation© 2010 NAVTEQ© (applies to Figure 57, Step 1 and Step 3).

