• Skip to main content
itrc_logo

Geospatial Analysis for Optimization at Environmental Sites

Navigating this Website
Overview
Fact Sheets
Fact Sheets Overview
Fact Sheet 1: Do You Need Geospatial Analysis?
Fact Sheet 2: Are Conditions Suitable for Geospatial Analysis?
Fact Sheet 3: How is Geospatial Analysis Applied?
Fact Sheet 4: What Software is Available to Help?
PM's Tool Box
PM's Tool Box Overview
Review Checklist
Choosing Methods
Common Misapplications
Optimization Questions
Geospatial Analysis Support for Optimization Questions in the Project Life Cycle
Data Requirements
General Considerations
Methods for Optimization
Geospatial Methods for Optimization Questions in the Project Life Cycle Stages
Release Detection
Site Characterization
Remediation
Monitoring
Closure
Documenting Results
Fundamental Concepts
Fundamental Concepts for Geospatial Analysis
Basic Data Concepts for Geospatial Analysis
Interpolation Methods and Model Prediction
Uncertainty in Geospatial Analyses
Characteristics of Interpolation Methods
Work Flow
Work Flow for Conducting Geospatial Analysis
Geospatial Analysis Work Flow Overview
Perform Exploratory Data Analysis
Select Geospatial Method
Build Geospatial Model
Evaluate Geospatial Method Accuracy
Generate Geospatial Analysis Results
Using Results
Using Analysis Results for Optimization
Plume Intensity and Extent
Trend Maps
Estimating Quantities
Hot Spot Detection
Sample Spacing
Estimating Concentrations Based on Proxy Data
Background Estimation
Quantifying Uncertainty
Remedial Action Optimization
Monitoring Program Optimization
Examples
Examples Overview
Example 1
Example 2
Example 3
Example 4
Methods
Methods Overview
Simple Geospatial Methods
More Complex Geospatial Methods
Advanced Methods
Index of Methods
Software
Software Overview
Software Comparison Tables
Software Descriptions
Workshops and Short Courses
Case Studies
Case Studies Overview
Superfund Site Monitoring Optimization (MAROS)
PAH Contamination in Sediments—Uncertainty Analysis (Isatis)
Optimization of Long-Term Monitoring at Former Nebraska Ordnance Plant (GTS; Summit Envirosolutions)
Optimization of Lead-Contaminated Soil Remediation at a Former Lead Smelter (EVS/MVS)
Extent of Radiological Contamination in Soil at Four Sites near the Fukushima Daiichi Power Plant, Japan (ArcGIS)
Optimization of Groundwater Monitoring at a Research Facility in New Jersey (GWSDAT)
Optimization of Sediment Sampling at a Tidally Influenced Site (ArcGIS)
Stringfellow Superfund Site Monitoring Optimization (MAROS)
Lead Contamination in Soil (ArcGIS)
Stakeholder Perspectives
Additional Information
Project Life Cycle Stages
History of Remedial Process Optimization
Additional Resources
Acronyms
Glossary
Index of Methods
Acknowledgments
Team Contacts
Document Feedback


Geospatial Analysis for Optimization at Environmental Sites
HOME

Choosing Methods

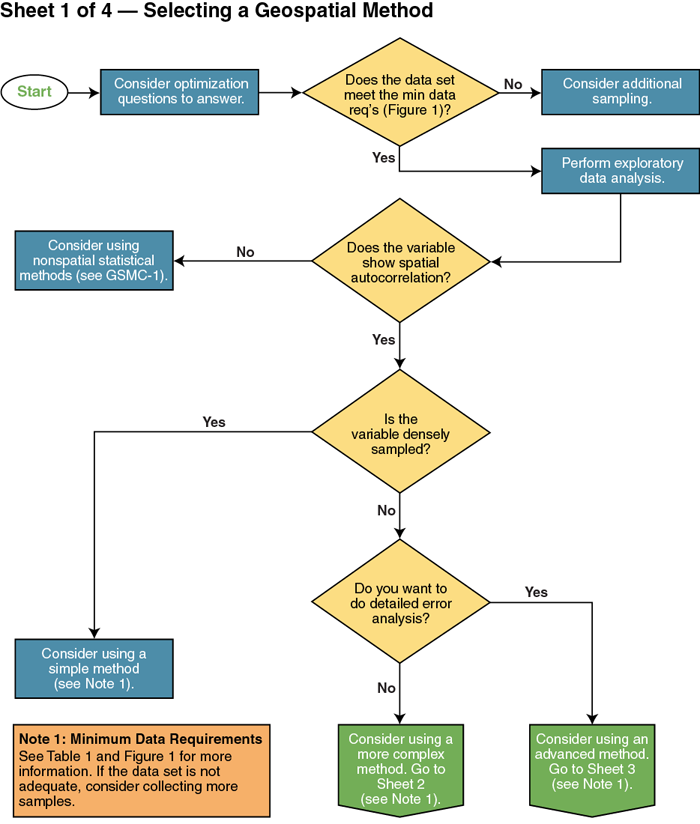
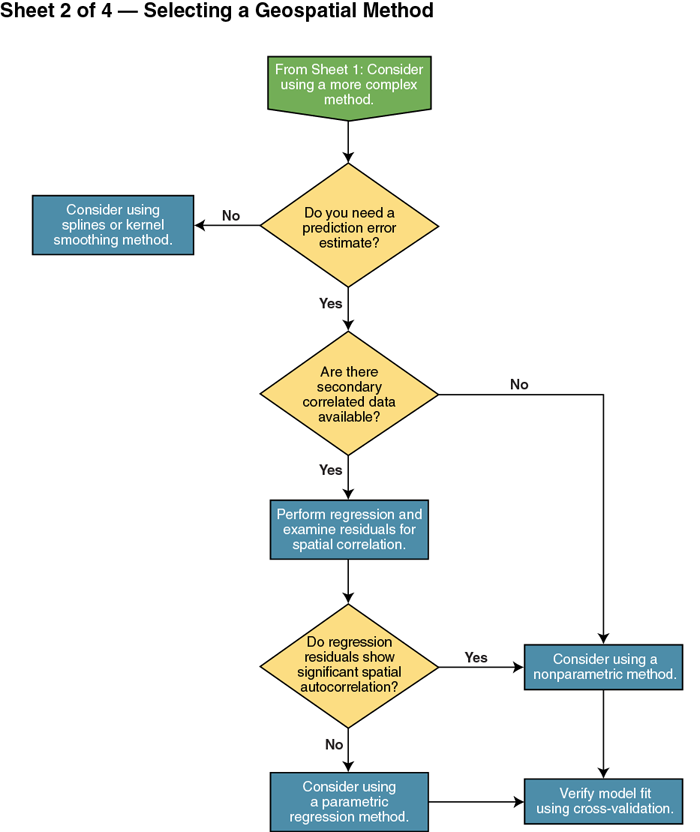
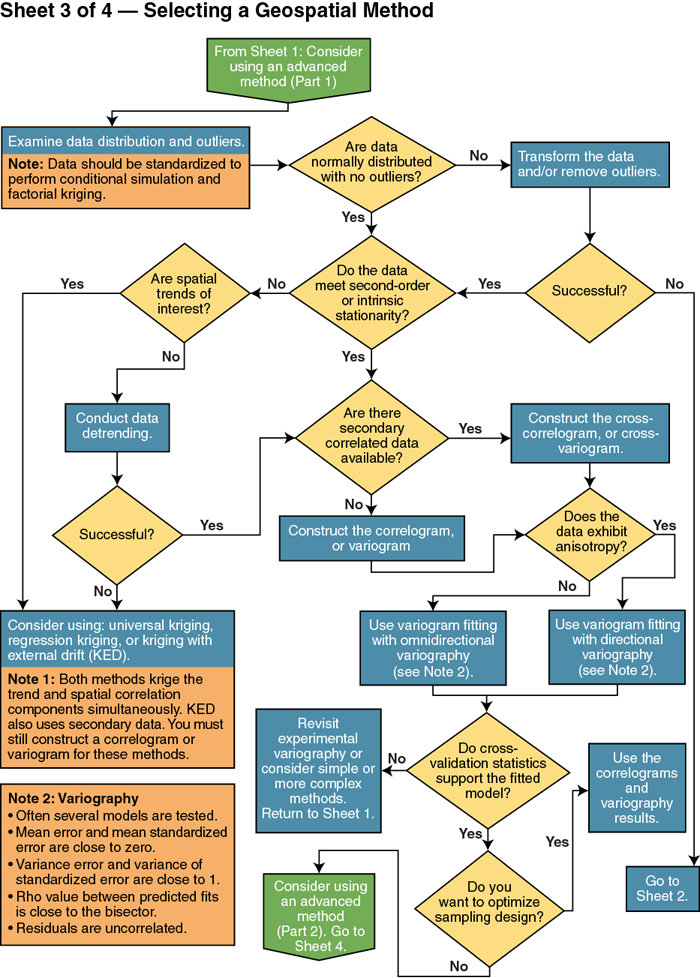
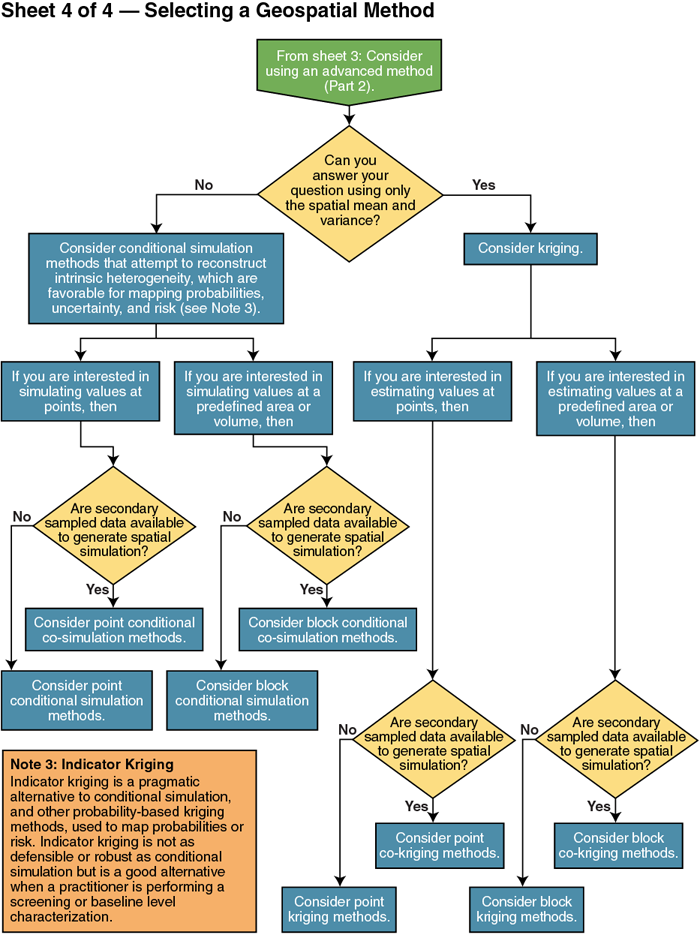
This guidance provides information about selecting a geospatial method. The following flow charts provide more detailed information about choosing a geospatial method. Follow the steps below to choose the geospatial methods that may be appropriate to conduct the geospatial analysis:

Step 1. What questions are you trying to answer for each phase in the project life cycle? See Geospatial Methods for Optimization Questions in the Project Life Cycle Stages.

Step 2. Do you have the minimum data required in order to use geospatial methods? See Table 1 and Figure 1.

Step 3: Perform exploratory data analysis.

Step 4. Use the flow charts below to determine if simple, more complex, or advanced methods are suitable for the geospatial analysis.

GRO Flow Chart Sheet 1 of 4


Click Here to go to Consider optimization questions Click Here to go to GSMC-1 Click Here to go to Perform Exploratory Data Analysis Click Here to go to Simple Methods Click Here to go to GRO Flow Chart Sheet 2 of 4 Click Here to go to GRO Flow Chart Sheet 3 of 4


GRO Flow Chart Sheet 2 of 4


Click Here to go to Splines and Kernel Smoothing Click Here to go to Spatial Correlation Models Click Here to go to More Complex Methods Click Here to go to Cross Validation Click Here to go to Parametric Regression


GRO Flow Chart Sheet 3 of 4


Click Here to go to information on outliers Click Here to go to Examine data distribution and outliers Click Here to go to Conduct data detrending Click Here to go to Fitting Varigram Click Here to go to Variogram Click Here to go to Directional Variograms Click Here to go to Using Analysis Results for Optimization Click Here to go to GRO Flow Chart Sheet 1 of 4 Click Here to go to GRO Flow Chart Sheet 2 of 4 Click Here to go to GRO Flow Chart Sheet 4 of 4 Click Here to go to Fitting Variogram Click Here to go to Kriging


GRO Flow Chart Sheet 4 of 4

Click Here to go to Conditional Simulation Click Here to go to Kriging Click Here to go to Point and Block Kriging Click Here to go to Point and Block Kriging Click Here to go to Conditional Simulation Click Here to go to Conditional Simulation Click Here to go to Co-kriging Click Here to go to Point and Block Kriging Click Here to go to Point and Block Kriging Click Here to go to Co-kriging

image_pdfPrint this page/section


GRO

web document
glossaryGRO Glossary
referencesGRO References
acronymsGRO Acronyms
ITRC
Contact Us
About ITRC
Visit ITRC
social media iconsClick here to visit ITRC on FacebookClick here to visit ITRC on TwitterClick here to visit ITRC on LinkedInITRC on Social Media
about_itrc
Permission is granted to refer to or quote from this publication with the customary acknowledgment of the source (see suggested citation and disclaimer). This web site is owned by ITRC • 1250 H Street, NW • Suite 850 • Washington, DC 20005 • (202) 266-4933 • Email: [email protected] • Terms of Service, Privacy Policy, and Usage Policy ITRC is sponsored by the Environmental Council of the States.