Optimization of Lead-Contaminated Soil Remediation at a Former Lead Smelter (EVS/MVS)
Contact: Kerry Stonestreet, Cascade Environmental, [email protected]
Steve McGinnis, Ramboll Environ, [email protected]

Problem Statement
At a former lead smelter a remedial investigation (RI) confirmed that the shallow soils were contaminated with metals exceeding the regulatory risk-based standards. EVS/MVS was used to delineate the volume of affected soil and design an optimized soil excavation.
Site Background and Project Objectives
The midcontinent has a substantial number of former smelter sites in need of remedial closure. These sites typically include tens to hundreds of acres, slag disposal areas of varying configurations, residual structures or associated debris, and ecological concerns. The State of Illinois is seeking a pragmatic presumptive remedy for these sites that consists of a 2 ft soil cap with a 6 inch protective layer (a cap consistent with 35 IAC Part 807) over consolidated Bevill-exempt wastes.
C Tech Development Corporation’s Environmental Visualization System (EVS) and Mining Visualization System (MVS) were used to design and guide a multiphase, cost-effective reclamation of one such former smelter site. Specifically, MVS1 was used to calculate the volume of soils with concentrations above the regulatory limit, design multiple site excavations, and monitor volumes of excavated and placed material using survey quality GPS coordinates located on the excavation equipment.
The project site consists of a 62-acre former lead smelter that operated from the early 1900s through 1950s. The former plant area is situated on an upland plateau and was demolished in place in the early 1960s. Wastewater and approximately 1.5 million tons of slag generated by the smelter were managed in a 13 acre portion of the site’s bottom lowlands behind a levee. In addition to slag, initial site investigations identified metals in soils, building debris, and former stack debris across large portions of the site’s upland area, as well as metals in soils/sediments and localized groundwater effects in a low-pH area of the lowland outfalls. Soil and groundwater investigations were completed in 2011 and 2012 to support risk assessments, a feasibility study, and remedial design.
Site remedial activities were initiated in early 2013. Through a collaborative interagency coordination and permitting process, 12,000 cubic yards of soils and sediments were efficiently excavated from the lowland on an expedited basis during a historically dry period. Due to poor geotechnical quality, these materials were mixed with 16,000 cubic yards of site building debris prior to placement on top of the slag pile. Lowland backfilling was conducted with crushed limestone and clay to mitigate low groundwater pH and potential for levee-area sand boils. This area served as the site’s in situ groundwater remedy.
Among other seasonal preparations conducted during 2013, approximately 15,000 cubic yards of clean dredged sediments were brought to the site from a nearby state park for beneficial reuse in the site remediation process through a collaborative Illinois interagency agreement. The reuse of these dredge materials alleviated a material disposition problem for park officials while cost-effectively providing site capping materials.
In April 2014, work began on the final phases of site remediation. Approximately 108,000 cubic yards of affected upland soils and debris were excavated and consolidated at the slag pile for capping. To provide further beneficial use of resources, silty-clay soils mined from the site upland are being used for the cap’s two-foot low permeability layer, which is being compacted wet of optimum with no permeability specifications. The dredged sediments will be beneficially reused and mixed with low-level affected upland topsoil for the cap’s 6 inch topsoil layer. Upon completion of capping, industrial and commercial institutional controls will be placed on the site. Implementation of these remedial activities will cost-effectively complete the reclamation of this former lead smelter site by end of 2015.
Data Set

Analytical results from the RI were used as the input data set for EVS/MVS. Working with the regulatory agency, risk-based values for cadmium, lead, and mercury were identified for cleanup goals. The input data set consisted of 317 soil samples ranging from 0.5 to 10 feet bgs. Approximately 90% of the samples were collected from less than four feet bgs.
Methods
The RI completed in 2012 provided subsurface characterization data for EVS/MVS. Analytical results from the RI were formatted to meet the EVS input file format. The file format is a simple text file (for example, comma separated values) and consists of the sample coordinates (X, Y, sample depth, ground surface elevation) and the measured analytical result.
EVS/MVS recognizes and honors nondetect values. For example, a result of “<7.0 mg/kg” may be included in the input data set and evaluated by the interpolation process as a fraction of the detection limit. The user controls the influence of nondetect values prior to executing the interpolation method (for example, the user supplies a less than multiplier of 0.5 for nondetect values).
Multiple methods are available for interpolation of analytical data:
- two and three-dimensional kriging
- inverse distance weighting (Shepard and Franke/Nielson)
- natural neighbor
Similarly, options for interpolation of geologic or other surface-based data (for example, potentiometric surface) are available:
- two- and three-dimensional kriging
- inverse distance weighting (Shepard and Franke/Nielson)
- natural neighbor
- spline
- indicator geology and adaptive indicator kriging
For this project, 3D kriging was selected. Analytical data for lead, cadmium, and mercury were prepared and input to the Krig_3D module. Krig_3D was configured and executed resulting in a 3D model subset into 3D cells. Each cell contains the result of the kriged value. Kriging also provides estimates of geostatistical confidence and uncertainty; these data are mapped to the model cells and provide additional decision making parameters.
The application’s help module defines the EVS methodology for statistical bounds as follows (C Tech Development Corporation 2015a):
As a user defined alternative to confidence and uncertainty, EVS will provide statistical bounds on the parameter estimate. In other words, EVS will determine the nominal, minimum, and maximum estimated distribution based on a user specified confidence level. With EVS, you can now directly answer the question: With my limited measured data, to an 80% confidence level, what is the largest and smallest plume I can expect?
The output of Krig_3D can be connected to additional modules for additional processing or subsetting. If geologic or stratigraphic data are available, a 3D geologic model may be prepared and used as an input model to Krig_3D. This allows the output model of Krig_3D to be subset based not only on kriged analytical results but also individual stratigraphic layers. When adequate geologic data are available this is a preferred work flow as it allows the user to answer questions such as, what volume of the saturated soils are above the regulatory limit? Or what volume of the impacted vadose zone soil is coarse grained?
This work flow was used in an area of the site where a shallow groundwater table and associated flowing sand unit were identified. Working with the USACE, the excavation depth in this area (situated behind a major levee) was limited to 2 ft above the sand layer to limit potential flooding of the excavation as the soil overburden was removed above the hydraulic head (sand boils).
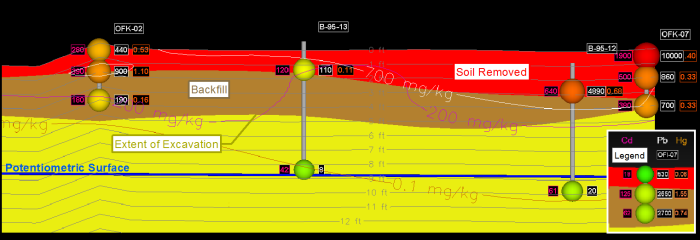
Figure 96. Cross-section illustrating the excavation design and backfill depths.
Spheres colored by lead (mg/kg), isoconcentration lines and potentiometric surface.
The MVS module “Union” (not available in EVS) was used to identify the volume of the 3D model where one or more contaminants were above their respective action limit. For the excavation design, the volume of soil with concentrations above 700 mg/kg lead, 200 mg/kg cadmium, or 0.1 mg/kg mercury were identified as requiring excavation. The Union module was used for evaluation of several combinations of contaminants and screening levels (for example, Industrial or Construction Worker). The module was also used to confirm that lead, cadmium, and mercury were the primary contaminants. Figure 97 depicts the Union module interface with five contaminants available for evaluation. The top panel of the module interface, Map Components, includes check boxes for data components that the module will export to subsequent modules (for example, the Viewer window).
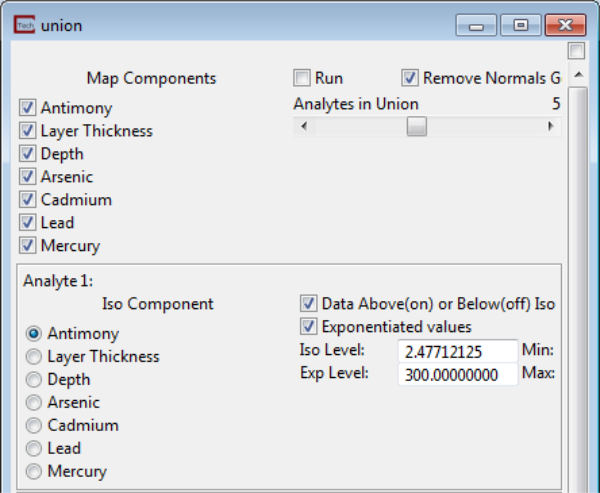
Figure 97. Union Module showing the first of the analytes evaluated (Analyte 1).
Two additional data components are visible in the Union module, Depth and Layer Thickness. These components and Elevation (not shown) are available for additional subsetting in previous or subsequent modules. If a geologic model was incorporated into the model prior to Krig_3D, then individual geologic units can be subset by these as well.
The use of the elevation subset component is illustrated in Figure 98. This area of the site transitioned from upland plateau to the lowland forming an irregular surface. A detailed ground surface prepared using LiDAR data was combined with sample depths derived from soil borings and test pit excavations to prepare a detailed model of the irregular slope material (Figure 99). Separating the upland and lowland material for reporting purposes was easily done with a horizontal slice at an elevation of 430 feet above mean sea level (ASML).
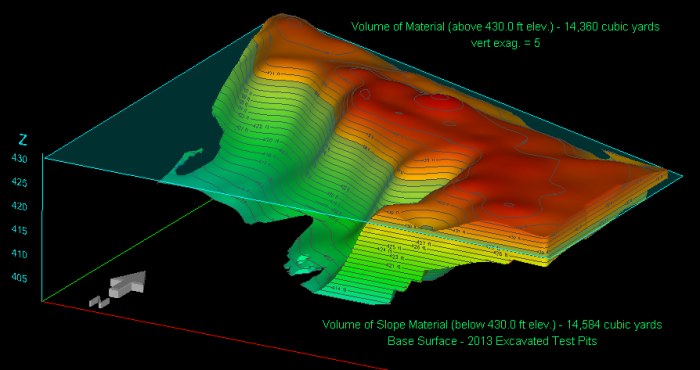 Figure 98. Volumetric model with irregular surface.
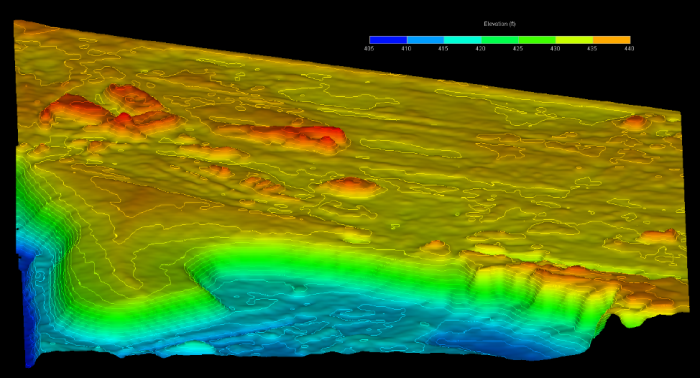 Figure 99. LiDAR-derived terrain model prior to remedy.
Results
The affected material identified for excavation is illustrated in Figure 100. The initial estimates identified 120,000 cubic yards of material on the upland plateau and 25,000 cubic yards in the lowland outfall area would require excavation and relocation to the engineered on-site repository.
 Figure 100. Oblique view of the site highlighting material identified for excavation (vertical exaggeration 5x horizontal).
The project is 90% complete with the final excavation and consolidation phase scheduled for completion in 2015. Overall, EVS/MVS was useful not only in planning an optimized excavation, but also for additional tasks throughout the project life cycle including calculating debris pile volumes, accounting for building foundations, and independent estimates to validate contractor estimates and invoices.
Lessons learned include managing the limitations encountered with any attempt to accurately model the subsurface based on a finite number of samples. Geospatial software packages such as EVS/MVS provide data-based solutions to manage uncertainty while also providing the effective reporting and communication tools.
 Figure 101. Final remedy in progress. Note GPS real time kinematic (RTK) base station on left side of photograph.
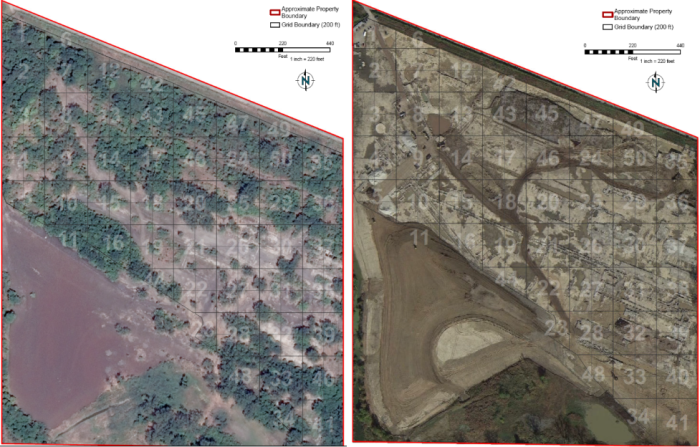 Figure 102. Site imagery – July 21, 2012 (pre-remedy) and status on October 21, 2014.
Source: Airbus Space and Defense and Google Earth Pro.
References
C Tech Development Corporation 2015a


