Optimization of Sediment Sampling at a Tidally Influenced Site (ArcGIS)
Contacts: Mark Malander, ExxonMobil Environmental Services Company, [email protected],
Jeffrey A. Johnson, Newfields, Inc., [email protected]

Problem Statement
The main objective of this case study is to assess the effectiveness of sediment sampling activities conducted between 2001 and 2008. Specifically, the analysis attempts to determine when data collection efforts at the site became redundant, with additional samples failing to provide useful, unique information for site characterization. Various summary statistics including cumulative sample count, maximum value, and average value for these periods are included in Table 15.
Table 15. Summary statistics for data collected between 2001 and 2008
| Year | Cumulative Sample Count | Maximum (ppm) | Average (ppm) |
|---|---|---|---|
| 2001 | 61 | 1,060 | 49.7 |
| 2002 | 240 | 2,300 | 27.6 |
| 2003 | 638 | 2,300 | 16.3 |
| 2004 | 651 | 2,300 | 16.0 |
| 2006 | 726 | 2,950 | 22.4 |
| 2008 | 749 | 2,950 | 21.9 |
Project Objectives
The primary goal of this case study is to demonstrate how the application of geospatial methods could have reduced the number of sampling locations required to delineate the area of sediment above risk-based concentrations. This approach would have reduced the time and cost needed to reach the original project goals. Additionally, geospatial methods could have been used to provide a more refined delineation, and avoid the pitfall of relying on isolated samples to represent large areas.
Data Set

A total of 749 sediment samples from more than 273 locations were collected from 2001 thru 2008 with respect to characterization of Total Aroclors within and near the aluminosilicate material (ASM) area. Nearly all of the investigated sediment samples represented 6-inch intervals, with few having variable intervals from 5 inches to 2 feet. The collected samples included large numbers of surficial sediments from 0 to 6 inches, as well as deeper samples ranging from 1 to 15 feet below surface.
Site Background
Located in the northeastern United States, the site consists of a 25-acre, tidally influenced embayment and surrounding upland areas off a small creek. The original embayment was created through historical excavation for borrow material and subsequent backfilling. The site is surrounded by industrial, commercial, and residential properties.
As part of historical petroleum processing at the site, a catalyst consisting of ASM was passed through a bath containing polychlorinated biphenyls (PCBs) and fired to a glass-like consistency. PCB-contaminated ASM waste was placed into a former borrow pit during the 1950’s. Previous environmental investigations revealed that sediments have become contaminated from buried material containing PCBs. The primary contaminants on site are Aroclors, including the main congeners of PCBs.
Methods
The geospatial analysis of the Site data included the steps illustrated in Figure 115.
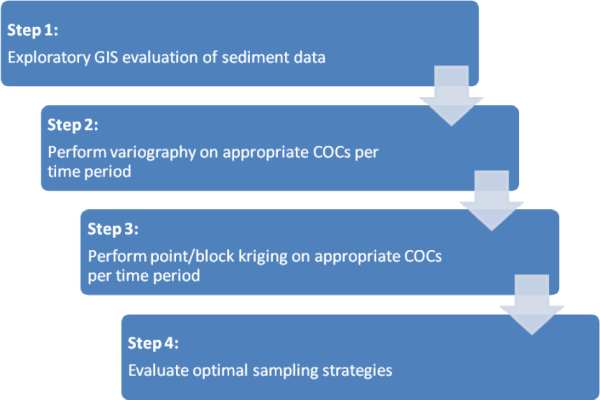 Figure 115. Geospatial analysis steps.
Step 1. Conduct exploratory GIS evaluation of sediment data.
A GIS data base was prepared prior to this analysis. The geodatabase included pertinent site information, such as registered aerial photographs, as well as former and current structures and site features. The GIS data base also contained soil sampling results for the entire site.
In this investigation, NewFields’ Geostat for ESRI™ ArcGIS 9.x (a custom application built on the ESRI ArcGIS platform) is used. This software is based on GSLIB (Deutsch and Journel 1992) geostatistical code, which was also the foundation of USEPA GEO-EAS and several other geostatistical software applications. NewFields’ software works within the ArcView GIS software as an extension. This extension is linked to Visual Basic and FORTRAN executables to calculate and map the sample variograms and compute kriged estimates. The following calculations can also be performed using other GIS-geostatistics integrated software, such as the commercially available ESRI Geostatistical Analys or publicly available SGeMS.
Electronic sample data were imported into a Microsoft (MS) Access database. The compiled data included measured concentrations of total Aroclors, as well as physical information on the actual sample, such as sample date, depth, type and coordinate location. Once the data were compiled into the MS Access database, exploratory statistical summaries were performed, such as depth averaging and frequency of detection. All analytical data incorporated within the GIS were directly exported from the Access database. The spatial distribution of Aroclor data as of 2008 is illustrated below; note that the highest concentrations are located within the historical ASM disposal area. An example time series progression of sample counts is illustrated in Figure 116 from 2001 to 2008.
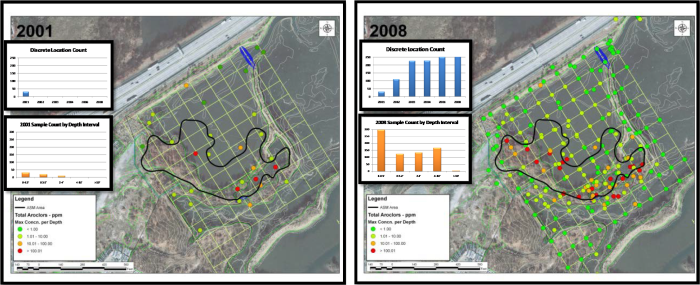 Figure 116. Total Aroclor sample count, time series.
Source: Street Map. Copyright © 2005 ESRI, Streetmaps. All rights reserved.
Before data were subjected to any further analysis, the following issues were addressed:
- For locations with more than one sample within a defined interval (duplicate samples), the maximum value was used.
- A zero value was used for nondetected results in the interval averaging.
Step 2. Perform variography on appropriate contaminants per time period.
Using the maximum concentration per location, omnidirectional variograms were generated for each of the six time periods. The data sets used represented cumulative samples per each chronological date. Note that depending on the project objectives, variography and kriging can be performed along specific directions or intervals.
Step 3a: Perform point kriging on appropriate contaminants per time period.
Using the fitted omnidirectional variogram models, point kriging contour maps were generated for each of the six time periods. For a direct chronological progression of the kriging results, see Figure 117, which illustrates two time periods. The absence of tangible change in the contamination structure after 2003 is remarkable. These results indicate that after 2003, no useful information regarding the extent of contamination was generated.
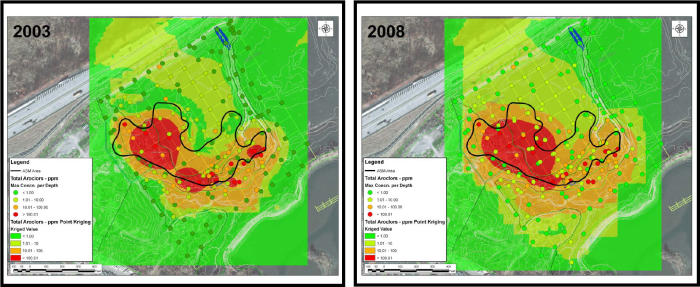 Figure 117. Total Aroclor point kriging, time series.
Map Source, Street Map: Copyright © 2005 ESRI, Streetmaps. All rights reserved.
Step 3b: Perform block kriging on appropriate COCs per time period.
To further evaluate the data, block kriging was performed on the data within the ASM disposal area. This area was the original source area and the focus of the majority of the sampling based on the existing CSM. Block kriging estimation was performed using the fitted omnidirectional variogram model for each of the six time periods. For estimation purposes, the ASM block was defined as a 500 ft by 1,000 ft rectangular area, encompassing the original ASM polygon.
The block kriging area is illustrated in Figure 118, along with a time series graph that presents the kriged concentration value and variance progression over each of the sample periods. For a direct chronological progression of the kriging results, see Figure 118, which illustrates two of the time series graphs. Figures 117 and 118 illustrate the absence of tangible change in mean concentration and kriging variance after 2003. Similar to previous findings, after 2003 no useful information regarding the nature or extent of contamination was generated.
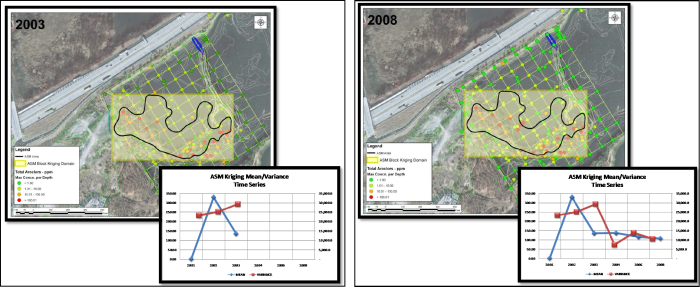 Figure 118. Total Aroclor ASM block kriging example.
Source: Street Map, Copyright © 2005 ESRI, Streetmaps. All rights reserved.
Step 4: Evaluate optimal sampling strategy.
Based on the GIS review, the variography, and the point and block kriging, an optimum sampling strategy can now be retroactively considered. That is, if geospatial analysis had been applied during the 2001 and 2002 sampling periods, a 400 ft grid sampling would have been recommended to complete the characterization and delineation of total Aroclors contamination in sediment. The 400 ft distance is the variogram range that measures the spatial correlation of the sample data set. If the strategy of 400 ft sample spacing had been applied in 2003, delineation (to 1 ppm) would have been completed with only an additional eight sample locations. However, 132 additional sample locations were collected from 2003 through 2008. These samples provided redundant information with respect to characterization of total Aroclors within the ASM area. Assuming the additional eight locations were sampled on average at three depth intervals (24 samples), the delineation would have been completed with just 264 samples. In comparison including the 2008 sampling event, the total sample count is 749. The geostatistical optimization represents a 65% reduction in samples. The savings in time and cost can be inferred as substantive. Figure 119 illustrates the proposed (yellow boxes) optimized sample locations versus the collected samples from 2003 through 2008.
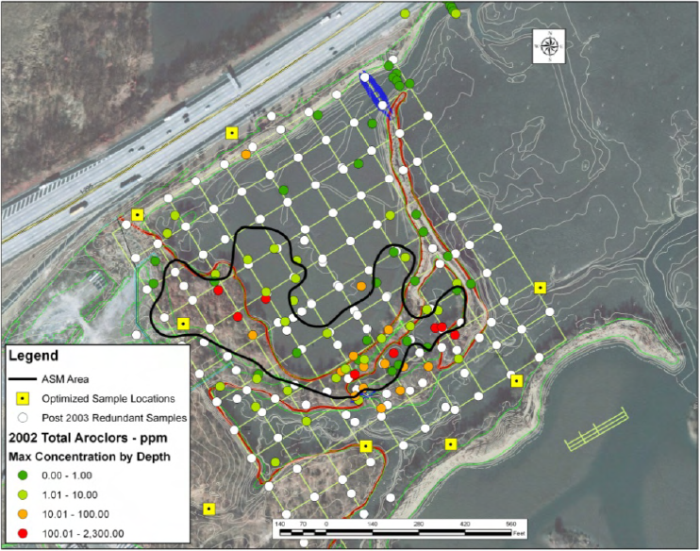 Figure 119. Proposed (yellow boxes) optimized sample locations.
Source: Street Map, Copyright © 2005 ESRI, Streetmaps. All rights reserved.
Results
This case study clearly highlights the following lessons learned:
- The CSM in 2001 was fairly accurate.
- Prior to 2003, initial judgmental sampling, consistent with the CSM, provided useful information.
- After 2003, judgmental sampling, in contrast to earlier efforts, provided mainly redundant information.
- Due to the absence of a quantitative measure of data adequacy, redundant sampling was conducted. Had geospatial methods been used earlier, adequate information could have been generated in 2002 by strategically positioning samples based on the findings of the variogram and estimation analyses.
- Geospatial techniques provide tools for developing quantitative measures of data adequacy and uncertainties.
- Both point and block kriging can be used to estimate potential remedial boundaries in unsampled areas while avoiding pitfalls of relying on few isolated results to condemn arbitrarily large areas.
The above lessons highlight the benefits of geospatial systematic sampling design, which are based on the following fundamental elements:
- clearly worded sampling objectives and intended decisions (with expressions of what decision errors are tolerable and which are not) prior to the start of field work
- a CSM that incorporates site-specific heterogeneities and contaminant distributions
- adaptive strategies to refine the CSM over the course of the project in relation to the intended decisions
- quantitative procedures for evaluating sampling and analytical uncertainties in data collection


