• Skip to main content
itrc_logo

Geospatial Analysis for Optimization at Environmental Sites

Home
About ITRC
Navigating this Website
Overview
Fact Sheets
Fact Sheets Overview
Fact Sheet 1: Do You Need Geospatial Analysis?
Fact Sheet 2: Are Conditions Suitable for Geospatial Analysis?
Fact Sheet 3: How is Geospatial Analysis Applied?
Fact Sheet 4: What Software is Available to Help?
PM's Tool Box
PM's Tool Box Overview
Review Checklist
Choosing Methods
Common Misapplications
Optimization Questions
Geospatial Analysis Support for Optimization Questions in the Project Life Cycle
Data Requirements
General Considerations
Methods for Optimization
Geospatial Methods for Optimization Questions in the Project Life Cycle Stages
Release Detection
Site Characterization
Remediation
Monitoring
Closure
Documenting Results
Fundamental Concepts
Fundamental Concepts for Geospatial Analysis
Basic Data Concepts for Geospatial Analysis
Interpolation Methods and Model Prediction
Uncertainty in Geospatial Analyses
Characteristics of Interpolation Methods
Work Flow
Work Flow for Conducting Geospatial Analysis
Geospatial Analysis Work Flow Overview
Perform Exploratory Data Analysis
Select Geospatial Method
Build Geospatial Model
Evaluate Geospatial Method Accuracy
Generate Geospatial Analysis Results
Using Results
Using Analysis Results for Optimization
Plume Intensity and Extent
Trend Maps
Estimating Quantities
Hot Spot Detection
Sample Spacing
Estimating Concentrations Based on Proxy Data
Background Estimation
Quantifying Uncertainty
Remedial Action Optimization
Monitoring Program Optimization
Examples
Examples Overview
Example 1
Example 2
Example 3
Example 4
Methods
Methods Overview
Simple Geospatial Methods
More Complex Geospatial Methods
Advanced Methods
Index of Methods
Software
Software Overview
Software Comparison Tables
Software Descriptions
Workshops and Short Courses
Case Studies
Case Studies Overview
Superfund Site Monitoring Optimization (MAROS)
PAH Contamination in Sediments—Uncertainty Analysis (Isatis)
Optimization of Long-Term Monitoring at Former Nebraska Ordnance Plant (GTS; Summit Envirosolutions)
Optimization of Lead-Contaminated Soil Remediation at a Former Lead Smelter (EVS/MVS)
Extent of Radiological Contamination in Soil at Four Sites near the Fukushima Daiichi Power Plant, Japan (ArcGIS)
Optimization of Groundwater Monitoring at a Research Facility in New Jersey (GWSDAT)
Optimization of Sediment Sampling at a Tidally Influenced Site (ArcGIS)
Stringfellow Superfund Site Monitoring Optimization (MAROS)
Lead Contamination in Soil (ArcGIS)
Stakeholder Perspectives
Additional Information
Project Life Cycle Stages
History of Remedial Process Optimization
Additional Resources
Acronyms
Glossary
Index of Methods
Acknowledgments
Team Contacts
Document Feedback


Geospatial Analysis for Optimization at Environmental Sites
HOME

Project Life Cycle Stages

Geospatial methods can apply throughout the life cycle of environmental cleanup projects, including monitoring of active remediation systems. The terminology and regulatory framework for the stages of the project within its life cycle, however, often vary under different regulatory programs. For clarity, this guidance organizes site management around five main tasks: release detection, site characterization, remediation, monitoring, and closure. These life cycle stages are appropriate for most groundwater remediation projects and apply to other media as well.

These tasks correlate with the activities described in various regulatory programs (such as RCRA, CERCLA, State Voluntary Cleanup, and UST Site Cleanup). Although individual projects may vary in their progression through these stages, statistical tests can support decision making regardless of how the project stages are defined. Figure 126 summarizes the correlations between the terms used in this guidance document and the terms used in several regulatory programs.

gro_app_a_fig_a_1
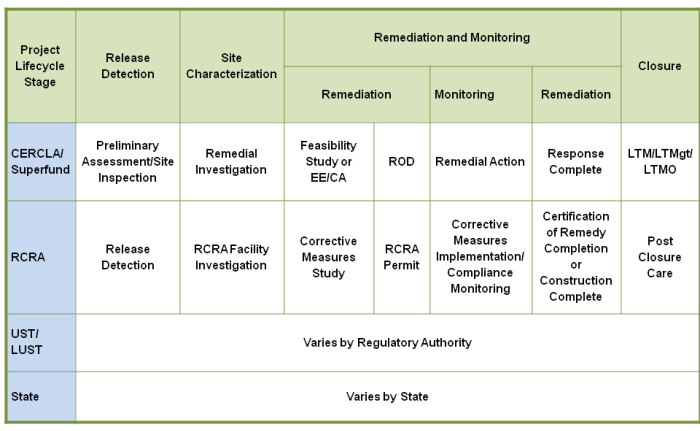
Figure 126. Correlation of regulatory terms.
Source: GSMC-1 (ITRC 2013), Adapted from ITRC RRM (ITRC 2011) IBT slide 2011.

Release Detection

▼Read more

At cleanup sites or at waste management facilities, groundwater monitoring may be used to determine if a release has occurred. A release may be detected by comparison of compliance well data to a criterion or by detection of a trend in the compliance well data. Groundwater concentrations may be compared to a criterion to determine facility compliance. A release may also be detected when the concentration of a chemical in groundwater exceeds background. Accordingly, an important aspect of release detection monitoring is determining the background concentrations (either natural or anthropogenic) for chemicals. Natural background would be representative of pristine or pre-industrial conditions. Anthropogenic background refers to concentrations in the surrounding groundwater that may be impacted by human activity, but not by the site.

Site Characterization

▼Read more

Site characterization is typically the first stage of a cleanup project. Site characterization describes the physical conditions of the site such as soils, geology, hydrology, the presence of existing contamination, the potential for contamination to be released, and the actual and potential pathways and mechanisms for contamination transport. This stage of the project life cycle considers the chemical characteristics of the contaminants and their potential to be mobile in the environment. All of these aspects of site characterization are needed to develop an appropriate groundwater-monitoring program, understand groundwater contaminant concentrations, and select and interpret groundwater statistical analyses.

Remediation

▼Read more

Remediation of contaminated groundwater is a challenge. On average, attainment of regulatory closure at sites with contaminated groundwater takes significantly longer compared to sites that have contaminated soil but no groundwater impacts. At many sites, it is estimated that attainment of groundwater standards will take decades or more (see NAP 2012 (National Academies Press (NAP) 2012)for a discussion of the challenges of managing complex contaminated groundwater sites).

This section provides guidance on the use of statistics to support remedy selection and evaluation of remedy effectiveness. For remediation, statistical analyses are most useful for evaluating changes in concentration over time (trend analyses). An objective and accurate evaluation of changes in contaminant concentrations over time can help to resolve groundwater remediation issues.

Monitoring

▼Read more

Groundwater monitoring is conducted to observe and assess characteristics of interest at cleanup, RCRA facility, or waste disposal sites. Often, monitoring is conducted on a long-term basis, sometimes for decades. Monitoring may be required even after closure of a site during postclosure monitoring. As such, monitoring may be conducted to describe characteristics at a specific location or point in time or to show how these characteristics change over time or space.

Changes in groundwater quality may have either natural or human causes. Proper evaluation of groundwater data helps you understand whether the criteria or goals of the monitoring program are met or if significant, adverse changes in groundwater concentrations have occurred. Proper design of the monitoring network depends upon the type of the site, the contaminants present, and the regulatory program. Prior to implementing a monitoring program, review well placement, parameter selection, sampling frequency, and whether or not a release has been identified. Typical activities in the monitoring stage include observing changes in concentration levels over time and space, and comparing concentrations to numerical criteria. After sufficient data are collected, it may also be possible to optimize sampling locations and sampling frequencies to improve and streamline the monitoring program.

Closure

▼Read more

Closure is the final stage of the project life cycle and therefore is subject to extra scrutiny. At this stage in the process, data planning and collection should have been managed through a systematic planning process and the CSM is assumed to be complete for the purposes of making a final determination on whether monitoring may be permanently discontinued and the site closed. This decision point may be reached at any time during the life cycle process (for example, during site characterization, remediation, or monitoring). Significant variation occurs across regulatory programs, but in general, when contaminants are no longer detected in any wells for several sampling events or over a specified period of time, the remedial goals are deemed complete and the groundwater is no longer considered contaminated. However, in instances where contaminants decrease but remain measurably present, or are present in natural or anthropogenic background, statistics can support a closure decision.

Given the importance of this decision, managers must have a high degree of confidence that the data fully support closure. Closure should verify that site contaminants are no longer present in the groundwater, or are not present at concentrations that pose an unacceptable risk to human health or the environment. In cases where concentrations of contaminants are allowed to remain (such as under institutional or engineering control scenarios), trend analysis results may be used to show that contaminants will not migrate or increase concentrations outside of the defined boundaries of the controlled area.

Following remediation, formal statistical testing will usually involve an upper confidence limit around the mean or an upper percentile compared against a criterion. The overriding concern in corrective action is that remediation efforts must have sufficient statistical proof to be declared successful. Since groundwater is now presumed to be contaminated, a facility should not exit corrective action until there is sufficient evidence that contamination has been abated (see Chapter 7.2, Unified Guidance).

By the time a site reaches the closure life cycle stage, the evaluation assumes that contamination exists. Therefore, the statistical approach may involve comparing an upper confidence limit of the data to a criterion. The upper confidence limit (UCL) should lie below the criterion to accept the hypothesis that concentration levels support closure. If the entire confidence interval (considering both the lower and upper confidence limits) lies below the criterion, there is statistically significant evidence that the true value of the parameter (for instance, the mean) is less than the criterion. When the confidence interval straddles the criterion, the correct decision is uncertain within the stated confidence level. The true value of the parameter might be less than or greater than the criterion and no clear decision with high statistical confidence is possible (see Chapter 5, Unified Guidance).

image_pdfPrint this page/section


GRO

web document
glossaryGRO Glossary
referencesGRO References
acronymsGRO Acronyms
ITRC
Contact Us
About ITRC
Visit ITRC
social media iconsClick here to visit ITRC on FacebookClick here to visit ITRC on TwitterClick here to visit ITRC on LinkedInITRC on Social Media
about_itrc
Permission is granted to refer to or quote from this publication with the customary acknowledgment of the source (see suggested citation and disclaimer). This web site is owned by ITRC • 1250 H Street, NW • Suite 850 • Washington, DC 20005 • (202) 266-4933 • Email: [email protected] • Terms of Service, Privacy Policy, and Usage Policy ITRC is sponsored by the Environmental Council of the States.